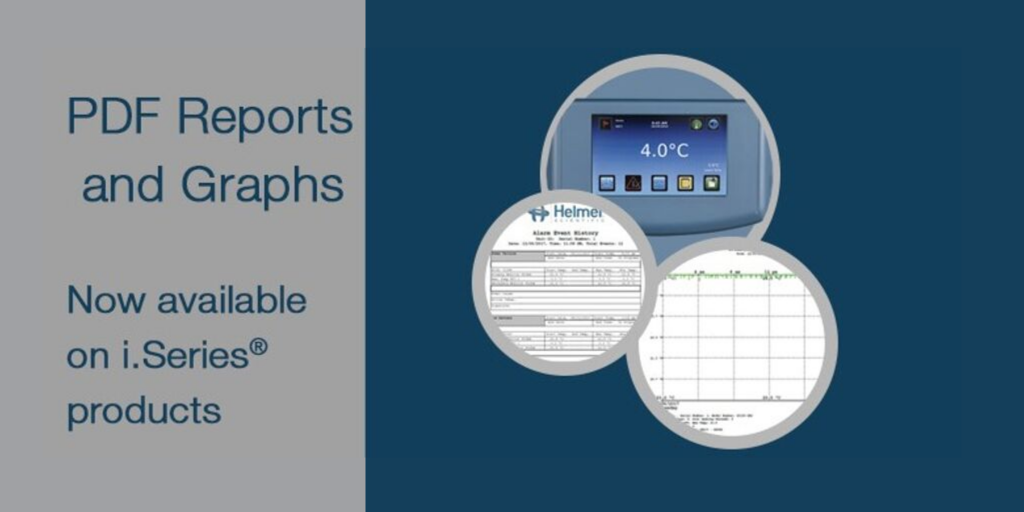
i.Series® temperature-controlled storage products from Helmer Scientific feature the i.C3® Information Center. The i.C3® touchscreen user interface provides constant temperature monitoring and robust reporting capabilities. It is integrated into i.Series® refrigerators, -30°C freezers, ultra-low freezers, and Pro Line countertop platelet incubators.
An important feature of the i.C3® Information Center is the ability to download temperature and event data files via USB. Recent updates to the i.C3® software offer the ability to download temperature graphs and alarm history report in PDF format as well.1
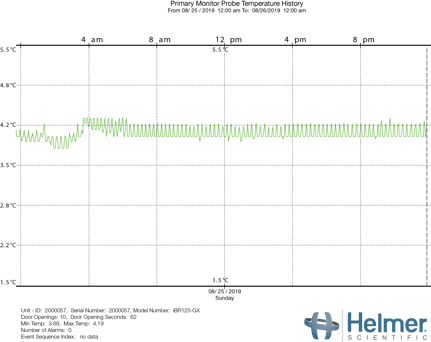 The PDF reporting functionality is easy to use and automatically generates graphs so there is no need for users to create them from data files. (If desired, data files can be downloaded as well, including up to 10 years of temperature data and event log history in CSV format.)
Helmer Scientific supports your efforts to properly store and monitor valuable products such as blood, reagents, medications, and vaccines. PDF reporting is easy to use, saves time, and supports regulatory compliance.
Graphs and reports can be generated in either 1-day or 7-day formats. To learn more, download our i.C3® Guide for PDF Reports.

1 Products with DP version 12.48 and later.
Other Blogs You Might Be Interested In...
- Helmer Scientific Is the First Vendor to Participate in New AABB Standards-Compliant Product Evaluation Program
- Easier Maintenance for Refrigerators and -30°C Freezers with Optional Solid Ballast
- GX Solutions Now Available for Upright Refrigerators
- Video Highlights the Benefits of Saving Energy and Reducing Cost with GX Solutions