Visibility into the temperature performance of storage devices can quickly alert users to any issues or provide reassurance that all is well. The ability to easily access and view this information in a user-friendly format can provide rapid insights into the performance of the unit.
The i.C3® Information Center is integrated into i.Series® temperature-controlled storage equipment. This includes refrigerators and freezers for laboratory, blood bank, pharmacy, and vaccine storage, as well as Pro Line platelet incubators. The i.C3® features an interactive temperature graph, which provides a visual history of temperature performance along with shortcuts to the Event Log for details on alarms or other events that may have occurred.
The visual history provided by the interactive temperature graph can be displayed in a 1-day or 7-day format. The graph screen also provides door open time, the number of door openings, and total events during the selected time span.
While the 7-day graph summarizes temperature performance over the past week, the 1-day view enables users to drill down into details. An alarm icon appears on the graph if an alarm has been activated. Simply touching the icon takes the user to the Event Log, which provides a summary of the event. Another touch takes the user to the detail screen, which provides full information related to the event.
In addition to the ability to view the temperature graph and event information directly on the screen, the i.C3® offers the ability to download this information via USB. It can be saved and/or printed from a PC, providing documentation of temperature history and events.
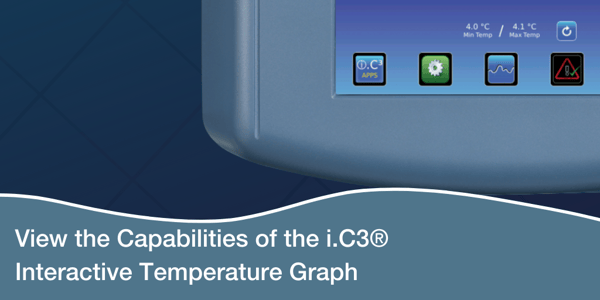
A series of videos has been created to illustrate the capabilities of the i.C3® Information Center. Watch our video below for a demonstration of the interactive temperature graph.
OTHER BLOGS YOU MIGHT BE INTERESTED IN...
- Heroes Behind the Scenes: Medical Laboratory Professionals
- Best of 2020: Blood Bank
- Best of 2020: Clinical Laboratory
- Video Highlights the Benefits of Saving Energy and Reducing Cost with GX Solutions
Look for additional videos that illustrate the major functions of the i.C3® Information Center on our BlueView blog.